Shot radar: scoring rate per shot position
Where does a player score from, where do they miss from – and where do the shots from there go? The shot radar shows the rate per shot position as a web, with the goal zones of the selected position below.
Where to find the shot radar Premium
- Player detail: the Shot radar section, right below the Shot map.
- Season analysis: the same for the whole team, matching the season, team and the Last 3/5/10 games filter.
What the radar shows
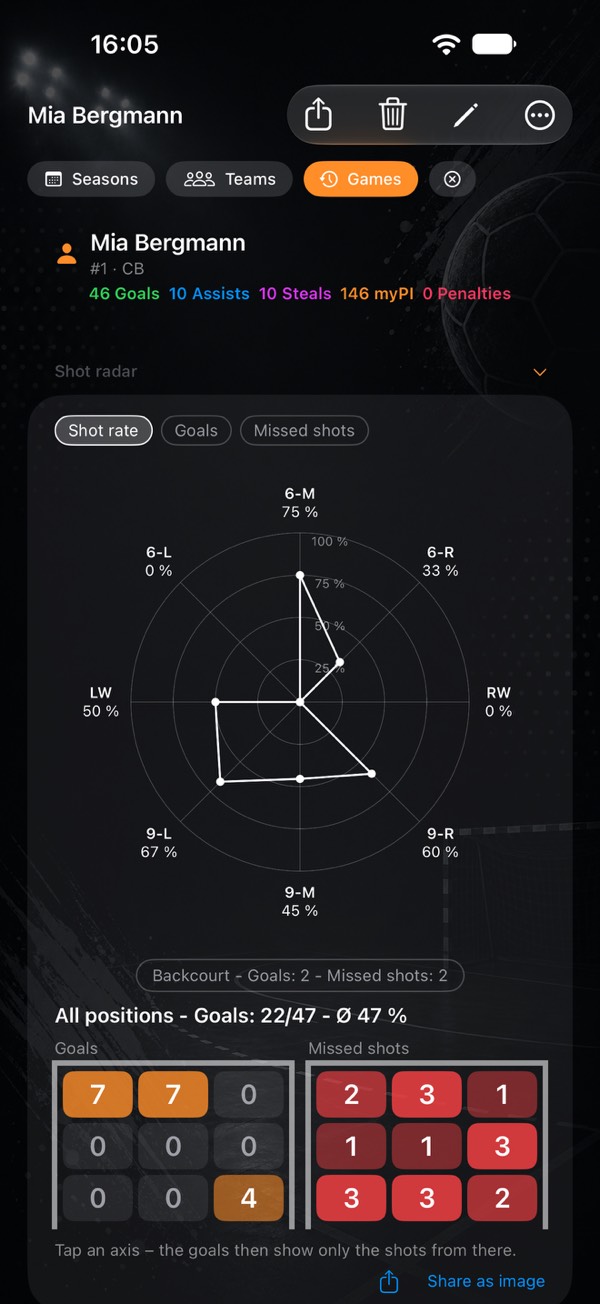
Eight axes, arranged like the court: 6-M at the top, 9-M at the bottom, on the right 6-R, RW and 9-R, on the left 9-L, LW and 6-L. Each axis carries its abbreviation, below it the rate, the count or both, depending on the layers.
| Abbreviation | Shot position |
|---|---|
| LW / RW | Left wing / Right wing |
| 6-L, 6-M, 6-R | 6 m left, center, right |
| 9-L, 9-M, 9-R | 9 m left, center, right |
| BC | Backcourt, as a separate row below the radar |
Backcourt is not an axis. Shots from your own half are rare and would put a dent in the web for almost every player. You can still tap the row below the radar just like an axis.
Shooter or goalkeeper
| View | Hits | Non-hits | Rate |
|---|---|---|---|
| Shooter | Goals | Missed shots | Shot rate |
| Goalkeeper | Saves | Goals conceded | Save percentage |
The switch only appears when both views have data. The app starts with the view that has more recorded, not with the position in the squad. So whoever was in goal today ends up in Goalkeeper automatically, see Goalkeeper and goals conceded.
Three layers, freely combined
Above the radar you switch three layers on and off. The app remembers your choice; the first time, only the rate is on.
| Layer | Display |
|---|---|
| Shot rate / Save percentage | Line without fill, with points, rings from 25 to 100 % |
| Goals / Saves | Area in orange |
| Missed shots / Goals conceded | Area in red with a dashed outline, distinguishable even without colour vision |
The two count layers share one scale: the largest value sits on the outer ring. If rate and count are on at the same time, the rings carry both values.
Why some axes are hollow and grey
A rate from just a few shots is misleading: one goal from one shot is 100 %. Switch on rate and goals together and each axis shows “hits/attempts”, for example 9-L 9/18, with the rate in small type below. Also:
- Below 3 attempts the point is hollow and the label grey.
- With no attempt the axis sits at 0 and shows “–”.
- Nothing is estimated or filled in, not even with thin data.
Tap an axis: the two goals below
Below the radar there are two goals side by side: hits and non-hits, each with the count in every goal zone. Tap an axis and both show only the shots from that position. The header above then reads, for example, 9 m left - Goals: 9/18 - Ø 50 %. A second tap on the same axis clears the selection again.
- All positions is the default: the goals then show all field shots with a goal zone, including those without a shot position.
- Shots without a goal zone count towards the rate but are missing from the goal. Below the goal it then says, for example, Without goal zone: 4, so the numbers add up.
Why 7 metres are missing
A penalty is always taken from the same spot, so the app doesn’t record a shot position for it. Without a position it doesn’t appear in the radar, nor in the goals below. The radar is a pure field-shot view for shooters and goalkeepers. Where 7 metres go is shown in the Shot map, their rate in the 7 metres card, see Season record.
Only the recent games
If you set Last 3, 5 or 10 games in the player detail or the season analysis, the radar only counts those games. The image for sharing names the filter in its header, so a partial analysis doesn’t look like the whole season.
Share as image
Share as image below the radar takes exactly what you see right now: the selected layers and the selected position with its two goals. Format Feed, Story or Landscape. In the player detail you choose, as with the player image, whether the name, first name or just the number appears on the image.
The radar stays empty
Then no shot with a shot position has been recorded yet. You choose the position during the game under Throw position, see What counts as what?. Imported match reports contain no shot positions and therefore don’t show up in the radar.
- Getting started: from an empty phone to your first stats
- Tracking player development: handball stats for youth teams and parents
- What counts as what? Every stat explained
- Goalkeeper and goals conceded
- Game clock, time-outs and match log
- End a game and enter totals
- Live session: record together
- myPI explained: the performance value per player
- Season record: record, form, fair play and 7 metres
- Player comparison and shot maps of the top scorers
- Squads and schedules as a table
- Importing official match reports
- Sharing a player as an image
- Match report as PDF: print and pin up
- Backups, switching devices, iCloud
- Free or Premium: what you get without buying
- Tips: quick questions, quick answers
Opens the print dialog – choose “Save as PDF” there. The page is laid out for it.