Player comparison and shot maps of the top scorers
Who scores more reliably, who loses fewer balls, where do your best players shoot? Two sections of the season analysis answer that at a glance – for your team and for exactly the games you have selected.
Where to find both Premium
Both are sections of the season analysis and follow its filter: season, team and Last 3/5/10 games. There is no separate filter. That way everyone compared stands on the same basis.
Player comparison: up to three players
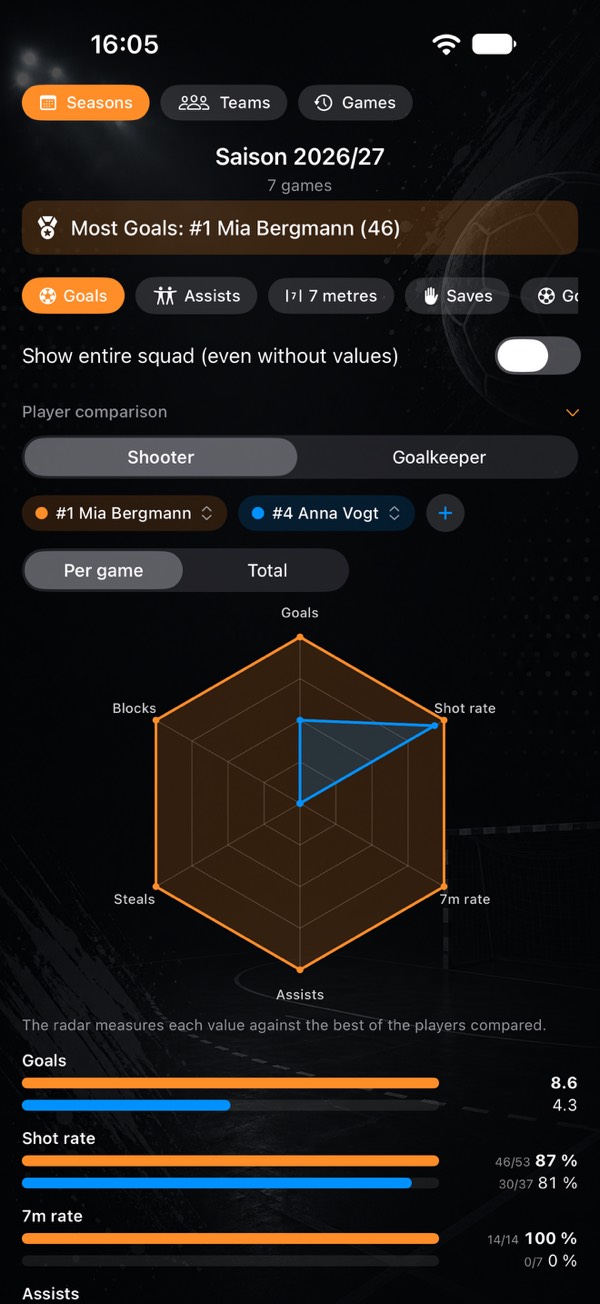
- Default: the two players with the most goals (in the Goalkeeper view: with the most shots on goal).
- Swap players: tap one of the coloured chips and choose another. With three players you can Remove one there.
- Add a third: via + next to the chips.
- Available are only players with stats in the current selection. If there are fewer than two, a note appears instead.
If there is shooter and goalkeeper data, you choose Shooter or Goalkeeper at the top. The choice applies as long as the view is open.
Per game or total
The default is Per game: counts such as goals or assists divided by the games in which the player has at least one recorded action. With Total you see the overall numbers, for goals also “incl. 3 7m”. Rates and the myPI stay the same with both settings.
The stats
| View | Stats |
|---|---|
| Shooter | Goals, shot rate, 7m rate, assists, steals, blocks, technical faults, 2 minutes, myPI |
| Goalkeeper | Saves, save percentage, 7m saves, goals conceded, myPI |
- Goals are field goals plus converted 7 metres. The shot rate only counts field shots, the 7m rate only real 7m shots.
- Rates from totals, not as an average of the per-game rates. Below them is “hits/attempts”, e.g. “6/9”. Below 3 attempts it shows “–” instead of a rate.
- myPI is the average over the games, see myPI explained.
The radar: measured against the best of the group
Each axis is a stat, six for shooters (goals, shot rate, 7m rate, assists, steals, blocks), four for goalkeepers (saves, save percentage, 7m saves, myPI). Whoever has the best value among those compared on an axis sits on the outer ring.
100 % means “best of this group”, not “perfect”. For example: if player A scores 4.0 goals per game and player B 2.0, A sits on the outer ring and B halfway up. Add a third who scores 8.0, and both move inwards. So the radar only compares within the selection.
Technical faults, suspensions and goals conceded are deliberately not in the radar. For them, lower is better, and on a web where outside otherwise means “good”, that is confusing.
The bars
Below the radar, each stat has its own row, with one bar per player in their colour. The longest bar belongs to the largest value in the row, the best value is bold. A downward arrow marks “lower is better” (technical faults, 2 minutes, goals conceded): there the shortest bar is the best.
Player comparison as an image
Share as image creates an image with the radar and a table: for each player the value in their colour, the best in bold. The header states the basis, e.g. team, season and Last 5 games. As with the player image, you choose Name, First name or Number. The choice applies to all players in the image, and the app remembers it.
Shot maps of the top scorers
Where do your top players shoot? The section shows the top four by field goals, each tile with number and name, a small goal with the count per goal zone and below it hits, shots and rate, for example “Goals 37/84 - 44 %”.
- Switch at the top: Field goal or Missed shot for shooters, Save or Conceded goal for goalkeepers. They are then sorted by shots on their goal, and the row shows saves and save percentage.
- Without goal zone: n below a tile: shots without a goal zone count towards the rate and the order, but are missing from the goal.
- 7 metres are left out. They have a fixed spot; their rate is in the 7 metres card, see Season record.
- Tapping a tile opens the player detail, which has the shot radar per position.
- Share as image takes all four tiles, with the basis in the header and the same name choice as above.
- Getting started: from an empty phone to your first stats
- Tracking player development: handball stats for youth teams and parents
- What counts as what? Every stat explained
- Goalkeeper and goals conceded
- Game clock, time-outs and match log
- End a game and enter totals
- Live session: record together
- myPI explained: the performance value per player
- Season record: record, form, fair play and 7 metres
- Shot radar: scoring rate per shot position
- Squads and schedules as a table
- Importing official match reports
- Sharing a player as an image
- Match report as PDF: print and pin up
- Backups, switching devices, iCloud
- Free or Premium: what you get without buying
- Tips: quick questions, quick answers
Opens the print dialog – choose “Save as PDF” there. The page is laid out for it.